 Veritas Data
Bloomin' Brands, Inc. (BLMN) earnings date
Feb 24, 2027, before open estimated
Estimated from the company's SEC filing cadence. The company has not confirmed it. Companies usually announce two to four weeks ahead.
- Fiscal period
- Q4 FY2026
- Confidence
- 45% chance of landing within a day
- Source
- Filing history on EDGAR
- Last checked
- 2026-11-19
Read by software from public filings and company announcements. Can be wrong. Verify with the company or the SEC. Not investment advice.
How this company behaves
| Announces its report date | Not enough announcements on file yet to say |
| Reports after the quarter ends | 38 days, typically, give or take 10 (last 8 releases) |
Last 8 releases
| Period | Released | Timing | Days after period end | Filing |
|---|---|---|---|---|
| Q3 FY2026 | Fri, Nov 6, 2026 | before open | 40 | 8-K |
| Q2 FY2026 | Wed, Aug 5, 2026 | before open | 38 | 8-K |
| Q1 FY2026 | Wed, May 6, 2026 | before open | 38 | 8-K |
| Q4 FY2025 | Wed, Feb 25, 2026 | before open | 59 | 8-K |
| Q3 FY2025 | Thu, Nov 6, 2025 | before open | 39 | 8-K |
| Q2 FY2025 | Wed, Aug 6, 2025 | before open | 38 | 8-K |
| Q1 FY2025 | Wed, May 7, 2025 | before open | 38 | 8-K |
| Q4 FY2024 | Wed, Feb 26, 2025 | before open | 59 | 8-K |
What they guided beta
| Q3 FY2026 | "Document NEWS Exhibit 99.1 Tara Kurian SVP, IR, FP&A, and International (813) 830-5311 Bloomin’ Brands Announces 2026 Q3 Financial Results Q3 Diluted EPS of $(0.02) and Q3 Adjusted Diluted EPS of $(0.17) Raises Full Year EPS Guidance TAMPA, Fla., November 6, 2026 - Bloomin’ Brands, Inc. (Nasdaq: BLMN) today reported results for the third quarter 2026 (“Q3 2026”) compared to the third quarter 2025 (“Q3 2025”)." exhibit |
| Q3 FY2026 | "GAAP operating income (loss) margin increased from Q3 2025 primarily due to: (i) lower impairment and closure costs, (ii) an increase in restaurant-level operating margin, as detailed below, and (iii) lapping general and administrative expenses related to transformational and restructuring initiatives and foreign currency forward contracts, partially offset by higher compensation expense." exhibit |
| Q3 FY2026 | "Third Quarter Comparable Restaurant Sales THIRTEEN WEEKS ENDED SEPTEMBER 27, 2026 COMPANY-OWNED Comparable restaurant sales (stores open 18 months or more): U.S. Outback Steakhouse 1.9 % Carrabba’s Italian Grill 0.6 % Bonefish Grill 5.3 % Fleming’s Prime Steakhouse & Wine Bar — % Combined U.S. 1.9 % Fiscal 2026 Financial Outlook The table below presents our updated expectations for selected 2026 financial operating results." exhibit |
| Q3 FY2026 | "Q4 2026 Financial Outlook The table below presents our expectations for selected fiscal Q4 2026 financial operating results." exhibit |
| Q3 FY2026 | "Financial Results: Q4 2026 Outlook U.S. comparable restaurant sales 0% to 1% Diluted earnings per share (1) $0.07 to $0.12 Adjusted diluted earnings per share (1) $0.07 to $0.12 ___________________ (1) Assumes diluted weighted average shares of approximately 88 million." exhibit |
| Q2 FY2026 | "Document NEWS Exhibit 99.1 Tara Kurian SVP, IR, FP&A, and International (813) 830-5311 Bloomin’ Brands Announces 2026 Q2 Financial Results Q2 Diluted EPS of $0.37 and Q2 Adjusted Diluted EPS of $0.39 Raises Full-Year Diluted and Adjusted Diluted EPS Guidance TAMPA, Fla., August 5, 2026 - Bloomin’ Brands, Inc. (Nasdaq: BLMN) today reported results for the second quarter 2026 (“Q2 2026”) compared to the second quarter 2025 (“Q2 2025”)." exhibit |
| Q2 FY2026 | "GAAP operating income margin increased from Q2 2025 primarily due to an increase in restaurant-level operating margin, as detailed below, and lower costs in connection with transformational and restructuring initiatives." exhibit |
| Q2 FY2026 | "Restaurant-level operating margin increased from Q2 2025 primarily due to: (i) higher average check per person, primarily due to pricing, (ii) productivity initiatives and (iii) lower pre-opening costs and health insurance expense." exhibit |
| Q2 FY2026 | "Second Quarter Comparable Restaurant Sales THIRTEEN WEEKS ENDED JUNE 28, 2026 COMPANY-OWNED Comparable restaurant sales (stores open 18 months or more): U.S. Outback Steakhouse 1.4 % Carrabba’s Italian Grill 1.7 % Bonefish Grill 8.1 % Fleming’s Prime Steakhouse & Wine Bar 1.6 % Combined U.S. 2.3 % Fiscal 2026 Financial Outlook The table below presents our updated expectations for selected 2026 financial operating results." exhibit |
| Q2 FY2026 | "Q3 2026 Financial Outlook The table below presents our expectations for selected fiscal Q3 2026 financial operating results." exhibit |
Get this as JSON
curl -H "X-API-Key: vt_live_..." https://api.veritasdata.dev/v1/next/BLMN
# how far back the record goes for this company
curl -H "X-API-Key: vt_live_..." https://api.veritasdata.dev/v1/coverage/BLMN
Put this date on your page
A badge that stays current. It links back to this page and needs no key. Embed it unmodified, with its link to this page intact: the badge is too small to carry the notice below, so the page it links to does.
Read by software from public filings and company announcements. Can be wrong. Verify with the company or the SEC. Not investment advice.
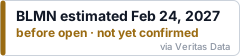
HTML
<a href="https://veritasdata.dev/company/BLMN/"><img src="https://veritasdata.dev/embed/BLMN.svg" alt="BLMN earnings date" width="240" height="56"></a>
Markdown
[](https://veritasdata.dev/company/BLMN/)
Script
<script async src="https://veritasdata.dev/embed/BLMN.js"></script>
Get a free key: 100 calls, every company
Sign in with GitHub or Google. The key works on every endpoint and in the MCP server.
curl -H "X-API-Key: vt_live_..." "https://api.veritasdata.dev/v1/next/BLMN"
Dates come only from SEC EDGAR and company announcements. Nothing here is investment advice.