 Veritas Data
CITIGROUP INC (C) earnings date
Jan 15, 2027, during market hours estimated
Estimated from the company's SEC filing cadence. The company has not confirmed it. Companies usually announce two to four weeks ahead.
- Fiscal period
- Q4 FY2026
- Confidence
- 45% chance of landing within a day
- Source
- Filing history on EDGAR
- Last checked
- 2026-11-19
Read by software from public filings and company announcements. Can be wrong. Verify with the company or the SEC. Not investment advice.
How this company behaves
| Announces its report date | Not enough announcements on file yet to say |
| Reports after the quarter ends | 14 days, typically, give or take 1 (last 8 releases) |
Last 8 releases
| Period | Released | Timing | Days after period end | Filing |
|---|---|---|---|---|
| Q3 FY2026 | Tue, Oct 13, 2026 | during market hours | 13 | 8-K |
| Q2 FY2026 | Tue, Jul 14, 2026 | during market hours | 14 | 8-K |
| Q1 FY2026 | Tue, Apr 14, 2026 | during market hours | 14 | 8-K |
| Q4 FY2025 | Wed, Jan 14, 2026 | during market hours | 14 | 8-K |
| Q3 FY2025 | Tue, Oct 14, 2025 | during market hours | 14 | 8-K |
| Q2 FY2025 | Tue, Jul 15, 2025 | during market hours | 15 | 8-K |
| Q1 FY2025 | Tue, Apr 15, 2025 | during market hours | 15 | 8-K |
| Q4 FY2024 | Wed, Jan 15, 2025 | during market hours | 15 | 8-K |
What they guided beta
| Q3 FY2026 | "The provision in the prior-year period was $2.5 billion, reflecting $2.2 billion of net credit losses and a net reserve build of $236 million, driven by portfolio growth and transfer risk, partially offset by changes in the macroeconomic outlook. Citigroup net income was $5.2 billion in the third quarter 2026, compared to net income of $3.8 billion in the prior-year period on a reported basis, driven by higher revenues and lower expenses, partially offset by a higher provision for credit losses." exhibit |
| Q3 FY2026 | "During the quarter, Citigroup returned $4.1 billion to common shareholders in the form of share repurchases and dividends. Citigroup ’ s preliminary CET1 Capital ratio (5) was 12.8% at quarter end, unchanged from the end of the prior quarter, driven by net income and lower deduction from DTA and other, offset by common share repurchases, the payment of common and preferred dividends and unrealized losses on AFS securities. Citigroup ’ s Supplementary Leverage ratio (5) for the third quarter 2026 was 5.0%, versus 5.2% at the end of the prior quarter. 3 Services ($ in millions, except " exhibit |
| Q2 FY2026 | "This compares to net income of $4.0 billion, or $1.96 per diluted share, on revenues of $21.7 billion for the second quarter 2025. Revenues increased 14% from the prior-year period, driven by growth in each of Citi’s five interconnected businesses and Legacy Franchises in All Other , as well as the impact of foreign exchange translation, partially offset by a decline in Corporate/Other, also in All Other . Net income was $5.8 billion, compared to $4.0 billion in the prior-year period, driven by higher revenues and a lower provision for credit losses, partially offset by higher expenses. " exhibit |
| Q2 FY2026 | "The provision in the prior-year period was $2.9 billion, reflecting $2.2 billion of net credit losses and a net ACL build of $638 million, driven by transfer risk, portfolio growth and changes to certain macroeconomic variables, partially offset by changes in credit quality. Citigroup net income was $5.8 billion in the second quarter 2026, compared to net income of $4.0 billion in the prior-year period, driven by higher revenues and a lower provision for credit losses, partially offset by higher expenses." exhibit |
| Q2 FY2026 | "Non-interest revenue of $1.0 billion increased 4%, driven by higher investment fee revenues, with growth in client investment assets of 14%, primarily offset by the absence of an approximate $80 million gain on sale of an alternative investments fund platform, which occurred in the second quarter 2025, as well as the loss of fee revenue from the sale of the trust business in the third quarter 2025. Citigold and Retail Banking revenues of $2.2 billion increased 17%, driven by higher deposit spreads and higher investment fee revenues. Private Bank revenues of $769 million increased 5%, drive" exhibit |
Get this as JSON
curl -H "X-API-Key: vt_live_..." https://api.veritasdata.dev/v1/next/C
# how far back the record goes for this company
curl -H "X-API-Key: vt_live_..." https://api.veritasdata.dev/v1/coverage/C
Put this date on your page
A badge that stays current. It links back to this page and needs no key. Embed it unmodified, with its link to this page intact: the badge is too small to carry the notice below, so the page it links to does.
Read by software from public filings and company announcements. Can be wrong. Verify with the company or the SEC. Not investment advice.
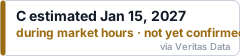
HTML
<a href="https://veritasdata.dev/company/C/"><img src="https://veritasdata.dev/embed/C.svg" alt="C earnings date" width="240" height="56"></a>
Markdown
[](https://veritasdata.dev/company/C/)
Script
<script async src="https://veritasdata.dev/embed/C.js"></script>
Get a free key: 100 calls, every company
Sign in with GitHub or Google. The key works on every endpoint and in the MCP server.
curl -H "X-API-Key: vt_live_..." "https://api.veritasdata.dev/v1/next/C"
Dates come only from SEC EDGAR and company announcements. Nothing here is investment advice.