 Veritas Data
Garrett Motion Inc. (GTX) earnings date
Feb 18, 2027, before open estimated
Estimated from the company's SEC filing cadence. The company has not confirmed it. Companies usually announce two to four weeks ahead.
- Fiscal period
- Q4 FY2026
- Confidence
- 52% chance of landing within a day
- Source
- Filing history on EDGAR
- Last checked
- 2026-11-19
Read by software from public filings and company announcements. Can be wrong. Verify with the company or the SEC. Not investment advice.
How this company behaves
| Announces its report date | Not enough announcements on file yet to say |
| Reports after the quarter ends | 30 days, typically, give or take 11 (last 8 releases) |
Last 8 releases
| Period | Released | Timing | Days after period end | Filing |
|---|---|---|---|---|
| Q3 FY2026 | Thu, Oct 29, 2026 | before open | 29 | 8-K |
| Q2 FY2026 | Wed, Jul 29, 2026 | before open | 29 | 8-K |
| Q1 FY2026 | Thu, Apr 30, 2026 | before open | 30 | 8-K |
| Q4 FY2025 | Thu, Feb 19, 2026 | before open | 50 | 8-K |
| Q3 FY2025 | Thu, Oct 23, 2025 | before open | 23 | 8-K |
| Q2 FY2025 | Thu, Jul 24, 2025 | before open | 24 | 8-K |
| Q1 FY2025 | Thu, May 1, 2025 | before open | 31 | 8-K |
| Q4 FY2024 | Thu, Feb 20, 2025 | before open | 51 | 8-K |
What they guided beta
| Q3 FY2026 | "Reaffirming 2026 full-year mid-point outlook Third Quarter 2026 Business Highlights" exhibit |
| Q3 FY2026 | "With this continued momentum we reaffirm our 2026 mid-point outlook, offsetting unfavorable foreign exchange, and remain focused on delivering long-term value for our shareholders,” said Olivier Rabiller, President and CEO of Garrett. $ millions (unless otherwise noted) Q3 2026 Q3 2025 YTD 2026 YTD 2025 Net sales 930 902 2,891 2,693 Cost of goods sold 724 716 2,277 2,147 Gross profit 206 186 614 546 Gross profit % 22.2% 20.6% 21.2% 20.3% Selling, general and administrative expenses 58 57 179 175 Income before taxes 119 102 363 289 Net income 97 77 293 226 Net income margin 10.4% 8.5% 10.1% 8.4" exhibit |
| Q3 FY2026 | "Net income for the third quarter of 2026 was $97 million as compared to $77 million in the third quarter of 2025 primarily driven by $20 million of increased gross profit, $3 million of lower tax expense, and $2 million of lower interest expense, partially offset by $4 million of higher non-operating expense (income) and $1 million of higher SG&A expense." exhibit |
| Q3 FY2026 | "Full Year 2026 Outlook Garrett is providing the following outlook for the full year 2026 for certain GAAP and non-GAAP financial measures." exhibit |
| Q3 FY2026 | "Full Year 2026 Outlook Prior Outlook Net sales (GAAP) $3.75 billion to $3.85 billion $3.7 billion to $3.9 billion Net sales growth at constant currency (Non-GAAP)* +2% to +6% +1% to +7% Net income (GAAP) $337 million to $352 million $330 million to $360 million Adjusted EBIT (Non-GAAP)* $570 million to $590 million $560 million to $600 million Net cash provided by operating activities (GAAP) $460 million to $500 million $435 million to $525 million Adjusted free cash flow (Non-GAAP)* $410 million to $450 million $385 million to $475 million * See reconciliations to the nearest GAAP measures be" exhibit |
| Q2 FY2026 | "Document Exhibit 99.1 Garrett Motion Reports Strong Second Quarter 2026 Results, Increases 2026 Outlook Second Quarter 2026 Financial Highlights" exhibit |
| Q2 FY2026 | "Increased 2026 full-year outlook Second Quarter 2026 Business Highlights" exhibit |
| Q2 FY2026 | "Net income for the second quarter of 2026 was $101 million as compared to $87 million in the second quarter of 2025 primarily driven by $31 million of increased gross profit and $1 million of lower interest expense, partially offset by $10 million of higher tax expense, $4 million of lower non-operating income and $4 million of higher SG&A expense." exhibit |
| Q2 FY2026 | "During the second quarter of 2026, we repurchased $28 million of our common stock under our authorized share repurchase program and we had remaining repurchase capacity of $135 million as of June 30, 2026. 3 Full Year 2026 Outlook Garrett is providing the following outlook for the full year 2026 for certain GAAP and Non-GAAP financial measures." exhibit |
| Q2 FY2026 | "Full Year 2026 Outlook Prior Outlook Net sales (GAAP) $3.7 billion to $3.9 billion $3.6 billion to $3.9 billion Net sales growth at constant currency (Non-GAAP)* +1% to +7% -2% to +6% Net income (GAAP) $330 million to $360 million $300 million to $360 million Adjusted EBIT (Non-GAAP)* $560 million to $600 million $520 million to $600 million Net cash provided by operating activities (GAAP) $435 million to $525 million $407 million to $522 million Adjusted free cash flow (Non-GAAP)* $385 million to $475 million $355 million to $475 million * See reconciliations to the nearest GAAP measures belo" exhibit |
Get this as JSON
curl -H "X-API-Key: vt_live_..." https://api.veritasdata.dev/v1/next/GTX
# how far back the record goes for this company
curl -H "X-API-Key: vt_live_..." https://api.veritasdata.dev/v1/coverage/GTX
Put this date on your page
A badge that stays current. It links back to this page and needs no key. Embed it unmodified, with its link to this page intact: the badge is too small to carry the notice below, so the page it links to does.
Read by software from public filings and company announcements. Can be wrong. Verify with the company or the SEC. Not investment advice.
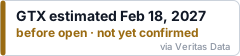
HTML
<a href="https://veritasdata.dev/company/GTX/"><img src="https://veritasdata.dev/embed/GTX.svg" alt="GTX earnings date" width="240" height="56"></a>
Markdown
[](https://veritasdata.dev/company/GTX/)
Script
<script async src="https://veritasdata.dev/embed/GTX.js"></script>
Get a free key: 100 calls, every company
Sign in with GitHub or Google. The key works on every endpoint and in the MCP server.
curl -H "X-API-Key: vt_live_..." "https://api.veritasdata.dev/v1/next/GTX"
Dates come only from SEC EDGAR and company announcements. Nothing here is investment advice.