 Veritas Data
W.W. GRAINGER, INC. (GWW) earnings date
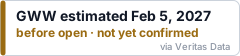
Feb 5, 2027, before open estimated
Estimated from the company's SEC filing cadence. The company has not confirmed it. Companies usually announce two to four weeks ahead.
- Fiscal period
- Q4 FY2026
- Confidence
- 45% chance of landing within a day
- Source
- Filing history on EDGAR
- Last checked
- 2026-11-19
Read by software from public filings and company announcements. Can be wrong. Verify with the company or the SEC. Not investment advice.
How this company behaves
| Announces its report date | Not enough announcements on file yet to say |
| Reports after the quarter ends | 33 days, typically, give or take 2 (last 8 releases) |
Last 8 releases
| Period | Released | Timing | Days after period end | Filing |
|---|---|---|---|---|
| Q3 FY2026 | Wed, Nov 4, 2026 | before open | 35 | 8-K |
| Q2 FY2026 | Tue, Aug 4, 2026 | before open | 35 | 8-K |
| Q1 FY2026 | Thu, May 7, 2026 | after close | 37 | 8-K |
| Q4 FY2025 | Tue, Feb 3, 2026 | before open | 34 | 8-K |
| Q3 FY2025 | Fri, Oct 31, 2025 | before open | 31 | 8-K |
| Q2 FY2025 | Fri, Aug 1, 2025 | before open | 32 | 8-K |
| Q1 FY2025 | Thu, May 1, 2025 | before open | 31 | 8-K |
| Q4 FY2024 | Fri, Jan 31, 2025 | before open | 31 | 8-K |
What they guided beta
| Q3 FY2026 | "Document GRAINGER REPORTS RESULTS FOR THE THIRD QUARTER 2026 Continued strong results across the business; Company increases full year 2026 earnings outlook Third Quarter Highlights" exhibit |
| Q3 FY2026 | "Increasing full year 2026 earnings outlook, including diluted adjusted EPS range of $47.00 to $48.00 CHICAGO, November 4, 2026 - Grainger (NYSE: GWW) today reported results for the third quarter of 2026 with sales of $5.2 billion, up 11.3%, or 14.9% on a daily, organic constant currency basis, and adjusted diluted EPS of $12.54, up 22.8% compared to the third quarter of 2025." exhibit |
| Q3 FY2026 | "Following another quarter of strong performance, we are increasing our 2026 guidance and remain on track for an exceptional year.” 1 2026 Third Quarter Financial Summary ($ in millions, except per share amounts) Q3 2026 Q3 2025 Q3'26 vs." exhibit |
| Q3 FY2026 | "During the quarter, the Company returned $396 million to Grainger shareholders through dividends and share repurchases. 3 Guidance The Company is updating the following guidance ranges for 2026: Total Company (1) Previous 2026 Guidance Range (as of August 4, 2026) Updated 2026 Guidance Range (as of November 4, 2026) Net Sales $19.4 - $19.7 billion $19.8 - $20.0 billion Sales growth 8.4% - 10.0% 10.1% - 11.6% Daily, organic constant currency sales growth 11.5% - 13.0% 13.0% - 14.5% Gross Profit Margin 39.3% - 39.6% 39.4% - 39.6% vs Prior Year 20 bps to 50 bps 30 bps to 45 bps Operating Margin 1" exhibit |
| Q2 FY2026 | "Document GRAINGER REPORTS RESULTS FOR THE SECOND QUARTER 2026 Continued strong results across the business; Company increases full year 2026 outlook Second Quarter Highlights" exhibit |
| Q2 FY2026 | "Increasing full year 2026 guidance, including diluted adjusted EPS range of $45.50 to $47.25 CHICAGO, August 4, 2026 - Grainger (NYSE: GWW) today reported results for the second quarter of 2026 with sales of $5.0 billion, up 10.3%, or 13.7% on a daily, organic constant currency basis, and diluted EPS of $12.01, up 20.5% compared to the second quarter of 2025." exhibit |
| Q2 FY2026 | "“Looking ahead, we are increasing our outlook to reflect our strong first half performance and the continued momentum we are seeing across the demand environment.” 1 2026 Second Quarter Financial Summary ($ in millions, except per share amounts) Q2 2026 (1) Q2 2025 (1) Q2'26 vs." exhibit |
| Q2 FY2026 | "During the quarter, the Company returned $341 million to Grainger shareholders through dividends and share repurchases. 3 Guidance The Company is updating the following guidance ranges for 2026: Total Company (1) Previous 2026 Guidance Range (as of May 7, 2026) Updated 2026 Guidance Range (as of August 4, 2026) Net Sales $19.2 - $19.6 billion $19.4 - $19.7 billion Sales growth 6.7% - 9.1% 8.4% - 10.0% Daily, organic constant currency sales growth 9.5% - 12.0% 11.5% - 13.0% Gross Profit Margin 39.2% - 39.5% 39.3% - 39.6% Operating Margin 15.6% - 16.0% 15.8% - 16.2% Diluted Earnings per Share $4" exhibit |
Get this as JSON
curl -H "X-API-Key: vt_live_..." https://api.veritasdata.dev/v1/next/GWW
# how far back the record goes for this company
curl -H "X-API-Key: vt_live_..." https://api.veritasdata.dev/v1/coverage/GWW
Put this date on your page
A badge that stays current. It links back to this page and needs no key. Embed it unmodified, with its link to this page intact: the badge is too small to carry the notice below, so the page it links to does.
Read by software from public filings and company announcements. Can be wrong. Verify with the company or the SEC. Not investment advice.
HTML
<a href="https://veritasdata.dev/company/GWW/"><img src="https://veritasdata.dev/embed/GWW.svg" alt="GWW earnings date" width="240" height="56"></a>
Markdown
[](https://veritasdata.dev/company/GWW/)
Script
<script async src="https://veritasdata.dev/embed/GWW.js"></script>
Get a free key: 100 calls, every company
Sign in with GitHub or Google. The key works on every endpoint and in the MCP server.
curl -H "X-API-Key: vt_live_..." "https://api.veritasdata.dev/v1/next/GWW"
Dates come only from SEC EDGAR and company announcements. Nothing here is investment advice.