 Veritas Data
Invitation Homes Inc. (INVH) earnings date
Feb 17, 2027, after close estimated
Estimated from the company's SEC filing cadence. The company has not confirmed it. Companies usually announce two to four weeks ahead.
- Fiscal period
- Q4 FY2026
- Confidence
- 52% chance of landing within a day
- Source
- Filing history on EDGAR
- Last checked
- 2026-11-19
Read by software from public filings and company announcements. Can be wrong. Verify with the company or the SEC. Not investment advice.
How this company behaves
| Announces its report date | Not enough announcements on file yet to say |
| Reports after the quarter ends | 30 days, typically, give or take 11 (last 8 releases) |
Last 8 releases
| Period | Released | Timing | Days after period end | Filing |
|---|---|---|---|---|
| Q3 FY2026 | Wed, Oct 28, 2026 | after close | 28 | 8-K |
| Q2 FY2026 | Wed, Jul 29, 2026 | after close | 29 | 8-K |
| Q1 FY2026 | Wed, Apr 29, 2026 | after close | 29 | 8-K |
| Q4 FY2025 | Wed, Feb 18, 2026 | after close | 49 | 8-K |
| Q3 FY2025 | Wed, Oct 29, 2025 | after close | 29 | 8-K |
| Q2 FY2025 | Wed, Jul 30, 2025 | after close | 30 | 8-K |
| Q1 FY2025 | Wed, Apr 30, 2025 | after close | 30 | 8-K |
| Q4 FY2024 | Wed, Feb 26, 2025 | after close | 57 | 8-K |
What they guided beta
| Q3 FY2026 | "“Following a solid third quarter, we are raising our full year guidance midpoints for Core FFO per share by $0.01 to $1.96, Same Store NOI growth guidance to 1.2%, and wholly owned home sales to $950 million, which supports our continued focus on closing the gap between public and private market values.”" exhibit |
| Q3 FY2026 | "Core FFO Year over year, Core FFO per share for Q3 2026 increased 2.4% to $0.48, while Core FFO per share for YTD 2026 increased 2.1% to $1.46, primarily due to a lower share count from stock repurchases and Same Store NOI growth." exhibit |
| Q3 FY2026 | "FY 2026 Guidance We have raised our full year 2026 guidance, including an increase to the Core FFO per share midpoint by $0.01 to $1.96 as set forth below, in addition to our other underlying assumptions." exhibit |
| Q3 FY2026 | "FY 2026 Guidance Summary Current Guidance Range Current Guidance Midpoint Prior Guidance Midpoint Change in Guidance Midpoint Core FFO per share — diluted $1.94 - $1.98 $1.96 $1.95 $0.01 AFFO per share — diluted $1.63 - $1.67 $1.65 $1.65 $— Same Store Core Revenues growth 1.65% - 2.15% 1.9% 1.9% —% Same Store Core Operating Expenses growth (1) 2.7% - 3.7% 3.2% 3.5% (0.3)% Same Store NOI growth 0.7% - 1.7% 1.20% 1.15% 0.05% Wholly owned acquisitions (2) $200 - $300 million $250 million $250 million $— million JV acquisitions (2) $100 - $150 million $125 million $100 million $25 million Wholly o" exhibit |
| Q3 FY2026 | "Q3 2026 Earnings Release and Supplemental Information — page 6 In accordance with SEC rules, we do not provide guidance for the most comparable GAAP financial measures of net income (loss) per share, total revenues, and property operating and maintenance expense." exhibit |
| Q2 FY2026 | "Reflecting our year to date performance, we have raised our full year 2026 guidance by one cent at the midpoint for both Core FFO per share and AFFO per share to $1.95 and $1.65, respectively." exhibit |
| Q2 FY2026 | "Given this performance, we have raised our full-year guidance by a penny at the midpoint for both Core FFO per share and AFFO per share, to $1.95 and $1.65, respectively.”" exhibit |
| Q2 FY2026 | "FY 2026 Guidance We have raised our full year 2026 guidance, increasing Core FFO per share and AFFO per share midpoints by one cent each to $1.95 and $1.65, respectively, as set forth below, in addition to our other underlying assumptions." exhibit |
| Q2 FY2026 | "FY 2026 Guidance Summary Current Guidance Range Current Guidance Midpoint Prior Guidance Midpoint Change in Guidance Midpoint Core FFO per share — diluted $1.92 - $1.98 $1.95 $1.94 $0.01 AFFO per share — diluted $1.62 - $1.68 $1.65 $1.64 $0.01 Same Store Core Revenues growth (1) 1.5% - 2.3% 1.9% 1.9% —% Same Store Core Operating Expenses growth (2) 3.0% - 4.0% 3.5% 3.5% —% Same Store NOI growth 0.4% - 1.9% 1.15% 1.15% —% Wholly owned acquisitions (3) $150 - $350 million $250 million $250 million $— million JV acquisitions (3) $50 - $150 million $100 million $100 million $— million Wholly owned" exhibit |
| Q2 FY2026 | "(2) Same Store Core Operating Expenses growth guidance assumes a year over year increase in FY 2026 (i) property taxes in a range of 4% to 5%; (ii) insurance expenses in a range of 5% to 7%; and (iii) all other expenses in a range of approximately 1% to 2%." exhibit |
Get this as JSON
curl -H "X-API-Key: vt_live_..." https://api.veritasdata.dev/v1/next/INVH
# how far back the record goes for this company
curl -H "X-API-Key: vt_live_..." https://api.veritasdata.dev/v1/coverage/INVH
Put this date on your page
A badge that stays current. It links back to this page and needs no key. Embed it unmodified, with its link to this page intact: the badge is too small to carry the notice below, so the page it links to does.
Read by software from public filings and company announcements. Can be wrong. Verify with the company or the SEC. Not investment advice.
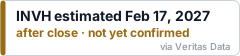
HTML
<a href="https://veritasdata.dev/company/INVH/"><img src="https://veritasdata.dev/embed/INVH.svg" alt="INVH earnings date" width="240" height="56"></a>
Markdown
[](https://veritasdata.dev/company/INVH/)
Script
<script async src="https://veritasdata.dev/embed/INVH.js"></script>
Get a free key: 100 calls, every company
Sign in with GitHub or Google. The key works on every endpoint and in the MCP server.
curl -H "X-API-Key: vt_live_..." "https://api.veritasdata.dev/v1/next/INVH"
Dates come only from SEC EDGAR and company announcements. Nothing here is investment advice.