 Veritas Data
Prologis, Inc. (PLD) earnings date
Jan 20, 2027, before open estimated
Estimated from the company's SEC filing cadence. The company has not confirmed it. Companies usually announce two to four weeks ahead.
- Fiscal period
- Q4 FY2026
- Confidence
- 52% chance of landing within a day
- Source
- Filing history on EDGAR
- Last checked
- 2026-11-19
Read by software from public filings and company announcements. Can be wrong. Verify with the company or the SEC. Not investment advice.
How this company behaves
| Announces its report date | Not enough announcements on file yet to say |
| Reports after the quarter ends | 16 days, typically, give or take 2 (last 8 releases) |
Last 8 releases
| Period | Released | Timing | Days after period end | Filing |
|---|---|---|---|---|
| Q3 FY2026 | Thu, Oct 15, 2026 | before open | 15 | 8-K |
| Q2 FY2026 | Thu, Jul 16, 2026 | before open | 16 | 8-K |
| Q1 FY2026 | Thu, Apr 16, 2026 | before open | 16 | 8-K |
| Q4 FY2025 | Wed, Jan 21, 2026 | before open | 21 | 8-K |
| Q3 FY2025 | Wed, Oct 15, 2025 | before open | 15 | 8-K |
| Q2 FY2025 | Wed, Jul 16, 2025 | before open | 16 | 8-K |
| Q1 FY2025 | Wed, Apr 16, 2025 | before open | 16 | 8-K |
| Q4 FY2024 | Tue, Jan 21, 2025 | before open | 21 | 8-K |
What they guided beta
| Q3 FY2026 | "At September 30, 2026, the company owned or had investments in, on a wholly owned basis or through co-investment ventures, properties and development projects expected to total approximately 1.3 billion square feet (123 million square meters) in 20 countries." exhibit |
| Q3 FY2026 | "Guidance(A) Highlights dollars in millions, except per share amounts 2026 Guidance Low High Net earnings attributable to common stockholders(B) $ 4.05 $ 4.15 Core FFO attributable to common stockholders/unitholders*(B) $ 6.25 $ 6.29 Core FFO attributable to common stockholders/unitholders, excluding Net Promote Income (Expense)*(B) $ 6.25 $ 6.29 Operations Average occupancy - Prologis Share 95.25 % 95.50 % Same store NOI - cash - Prologis Share* 7.00 % 7.50 % Same store NOI - net effective - Prologis Share* 5.50 % 6.00 % Other Assumptions Strategic capital revenue, excluding promote revenue $ " exhibit |
| Q3 FY2026 | "Our guidance for 2026 is based on management’s current beliefs and assumptions about our business, the industry and the markets in which we operate." exhibit |
| Q3 FY2026 | "Development Stabilizations Capital Deployment Three Months Ended September 30, 2026 Nine Months Ended September 30, 2026 TEI TEI square feet and dollars in thousands Square Feet Owned and Managed Prologis Share Square Feet Owned and Managed Prologis Share Central – $ – $ – 1,086 $ 179,669 $ 179,669 East 59 17,535 17,535 1,432 246,009 176,703 West(A)(B) 1,139 248,967 248,682 3,283 740,442 651,079 Total Industrial U.S. 1,198 266,502 266,217 5,801 1,166,120 1,007,451 Canada – – – 1,217 221,834 221,834 Brazil – – – 106 9,009 1,802 Mexico – – – 1,021 117,637 117,637 Total Other Americas – – – 2,344" exhibit |
| Q3 FY2026 | "Development Starts Capital Deployment Three Months Ended September 30, 2026 Nine Months Ended September 30, 2026 TEI TEI square feet and dollars in thousands Square Feet Leased % at Start Owned and Managed Prologis Share Square Feet Leased % at Start Owned and Managed Prologis Share Central 2,915 0.0 $ 325,540 $ 325,465 5,184 0.0 $ 634,206 $ 461,751 East 1,441 10.4 199,586 155,474 3,681 13.3 630,934 469,808 West (A)(B) 818 24.8 261,263 261,263 2,906 10.7 706,515 561,396 Total Industrial U.S. 5,174 6.8 786,389 742,202 11,771 6.8 1,971,655 1,492,955 Canada (A) – – – – – 100.0 52,152 52,152 Mexic" exhibit |
| Q2 FY2026 | "At June 30, 2026, the company owned or had investments in, on a wholly owned basis or through co-investment ventures, properties and development projects expected to total approximately 1.3 billion square feet (122 million square meters) in 20 countries." exhibit |
| Q2 FY2026 | "Guidance(A) Highlights dollars in millions, except per share amounts 2026 Guidance Low High Net earnings attributable to common stockholders(B) $ 4.40 $ 4.55 Core FFO attributable to common stockholders/unitholders*(B) $ 6.22 $ 6.30 Core FFO attributable to common stockholders/unitholders, excluding Net Promote Income (Expense)*(B) $ 6.22 $ 6.30 Operations Average occupancy - Prologis Share 95.25 % 95.75 % Same store NOI - cash - Prologis Share* 6.75 % 7.25 % Same store NOI - net effective - Prologis Share* 5.25 % 5.75 % Other Assumptions Strategic capital revenue, excluding promote revenue $ " exhibit |
| Q2 FY2026 | "Our guidance for 2026 is based on management’s current beliefs and assumptions about our business, the industry and the markets in which we operate." exhibit |
| Q2 FY2026 | "Development Stabilizations Capital Deployment Three Months Ended June 30, 2026 Six Months Ended June 30, 2026 TEI TEI square feet and dollars in thousands Square Feet Owned and Managed Prologis Share Square Feet Owned and Managed Prologis Share Central 349 $ 78,207 $ 78,207 1,086 $ 179,669 $ 179,669 East 1,044 152,303 83,240 1,373 228,474 159,168 West(A)(B) – 9,602 9,602 2,144 491,475 402,397 Total Industrial U.S. 1,393 240,112 171,049 4,603 899,618 741,234 Canada 1,217 221,834 221,834 1,217 221,834 221,834 Brazil – – – 106 9,009 1,802 Mexico 1,021 117,637 117,637 1,021 117,637 117,637 Total O" exhibit |
| Q2 FY2026 | "Development Starts Capital Deployment Three Months Ended June 30, 2026 Six Months Ended June 30, 2026 TEI TEI square feet and dollars in thousands Square Feet Leased % at Start Owned and Managed Prologis Share Square Feet Leased % at Start Owned and Managed Prologis Share Central 1,037 0.0 $ 159,715 $ 66,294 2,269 0.0 $ 308,666 $ 136,286 East 1,455 23.2 220,021 220,021 2,240 15.1 431,348 314,334 West (A)(B)(C) 1,260 8.5 194,867 102,728 2,088 5.2 445,252 300,133 Total Industrial U.S. 3,752 11.9 574,603 389,043 6,597 6.7 1,185,266 750,753 Canada (A) – 100.0 52,152 52,152 – 100.0 52,152 52,152 Me" exhibit |
Get this as JSON
curl -H "X-API-Key: vt_live_..." https://api.veritasdata.dev/v1/next/PLD
# how far back the record goes for this company
curl -H "X-API-Key: vt_live_..." https://api.veritasdata.dev/v1/coverage/PLD
Put this date on your page
A badge that stays current. It links back to this page and needs no key. Embed it unmodified, with its link to this page intact: the badge is too small to carry the notice below, so the page it links to does.
Read by software from public filings and company announcements. Can be wrong. Verify with the company or the SEC. Not investment advice.
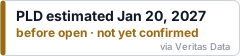
HTML
<a href="https://veritasdata.dev/company/PLD/"><img src="https://veritasdata.dev/embed/PLD.svg" alt="PLD earnings date" width="240" height="56"></a>
Markdown
[](https://veritasdata.dev/company/PLD/)
Script
<script async src="https://veritasdata.dev/embed/PLD.js"></script>
Get a free key: 100 calls, every company
Sign in with GitHub or Google. The key works on every endpoint and in the MCP server.
curl -H "X-API-Key: vt_live_..." "https://api.veritasdata.dev/v1/next/PLD"
Dates come only from SEC EDGAR and company announcements. Nothing here is investment advice.