 Veritas Data
TANGER INC. (SKT) earnings date
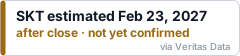
Feb 23, 2027, after close estimated
Estimated from the company's SEC filing cadence. The company has not confirmed it. Companies usually announce two to four weeks ahead.
- Fiscal period
- Q4 FY2026
- Confidence
- 45% chance of landing within a day
- Source
- Filing history on EDGAR
- Last checked
- 2026-11-19
Read by software from public filings and company announcements. Can be wrong. Verify with the company or the SEC. Not investment advice.
How this company behaves
| Announces its report date | Not enough announcements on file yet to say |
| Reports after the quarter ends | 35 days, typically, give or take 9 (last 8 releases) |
Last 8 releases
| Period | Released | Timing | Days after period end | Filing |
|---|---|---|---|---|
| Q3 FY2026 | Wed, Nov 4, 2026 | after close | 35 | 8-K |
| Q2 FY2026 | Tue, Aug 4, 2026 | after close | 35 | 8-K |
| Q1 FY2026 | Thu, Apr 30, 2026 | after close | 30 | 8-K |
| Q4 FY2025 | Tue, Feb 24, 2026 | after close | 55 | 8-K |
| Q3 FY2025 | Tue, Nov 4, 2025 | after close | 35 | 8-K |
| Q2 FY2025 | Mon, Aug 4, 2025 | after close | 35 | 8-K |
| Q1 FY2025 | Wed, Apr 30, 2025 | after close | 30 | 8-K |
| Q4 FY2024 | Wed, Feb 19, 2025 | after close | 50 | 8-K |
What they guided beta
| Q3 FY2026 | "Document EXHIBIT 99.1 Earnings Release and Supplemental Operating and Financial Data for the Quarter Ended September 30, 2026 Table of Contents Section Earnings Release i - xvii Portfolio Data: Summary Operating Metrics 3 Geographic Diversification 4 Property Summary - Occupancy at End of Each Period Shown 5 Portfolio Map 6 Portfolio Occupancy at the End of Each Period 6 Center Sales Per Square Foot Ranking 7 Top 25 Tenants Based on Percentage of Total Annualized Base Rent 8 Lease Expirations 9 Capital Expenditures 10 Transaction Summary 11 Leasing Activity 12 Financial Data: Consolidated Bala" exhibit |
| Q3 FY2026 | "Guidance for 2026 Based on the Company’s year-to-date results, its view on current market conditions, and its outlook for the remainder of 2026, management currently believes the Company’s full-year 2026 net income and FFO per share will be as follows: For the year ending December 31, 2026: Current Previous Low Range High Range Low Range High Range Estimated diluted net income per share $1.08 $1.12 $1.06 $1.13 Depreciation and amortization of real estate assets - consolidated and the Company’s share of unconsolidated joint ventures 1.41 1.41 1.39 1.39 Estimated diluted FFO per share $2.49 $2.5" exhibit |
| Q3 FY2026 | "In December 2018, Nareit issued “Nareit Funds From Operations White Paper - 2018 Restatement,” which clarifies, where necessary, existing guidance and consolidates alerts and policy bulletins into a single document for ease of use." exhibit |
| Q3 FY2026 | "Such risks and uncertainties include, but are not limited to: risks associated with general economic and financial conditions, including inflationary pressures and recessionary fears; newly-imposed and potentially additional U.S. tariffs and responsive non-U.S. tariffs; increased capital costs and capital markets volatility; increases in unemployment and reduced consumer confidence and spending; risks related to our ability to acquire or develop new retail centers or expand existing retail centers successfully; risks related to the financial performance and market value of our retail centers a" exhibit |
| Q3 FY2026 | "(2) Centers included in each ranking group above are as follows (in alphabetical order): Centers 1 - 6: Cleveland, OH (Pinecrest) Deer Park, NY Glendale, AZ (Phoenix) Huntsville, AL (Bridge Street Town Centre) Little Rock, AR (The Promenade at Chenal) Sevierville, TN Centers 7 - 12: Branson, MO Charleston, SC Fort Worth, TX Mebane, NC Myrtle Beach Hwy 17, SC Rehoboth Beach, DE Centers 13 - 18: Hilton Head I, SC Lancaster, PA Locust Grove, GA Nashville, TN Savannah, GA Southaven, MS (Memphis) Centers 19 - 24: Daytona Beach, FL Foley, AL Grand Rapids, MI Hershey, PA Kansas City, KS Riverhead" exhibit |
| Q2 FY2026 | "Document EXHIBIT 99.1 Earnings Release and Supplemental Operating and Financial Data for the Quarter Ended June 30, 2026 Table of Contents Section Earnings Release i - xvii Portfolio Data: Summary Operating Metrics 3 Geographic Diversification 4 Property Summary - Occupancy at End of Each Period Shown 5 Portfolio Map 6 Portfolio Occupancy at the End of Each Period 6 Center Sales Per Square Foot Ranking 7 Top 25 Tenants Based on Percentage of Total Annualized Base Rent 8 Lease Expirations 9 Capital Expenditures 10 Transaction Summary 11 Leasing Activity 12 Financial Data: Consolidated Balance " exhibit |
| Q2 FY2026 | "Guidance for 2026 Based on the Company’s year-to-date results, its view on current market conditions, and its outlook for the remainder of 2026, management currently believes the Company’s full-year 2026 net income and FFO per share will be as follows: For the year ending December 31, 2026: Current Previous Low Range High Range Low Range High Range Estimated diluted net income per share $1.06 $1.13 $1.05 $1.13 Depreciation and amortization of real estate assets - consolidated and the Company’s share of unconsolidated joint ventures 1.39 1.39 1.37 1.37 Estimated diluted FFO per share $2.45 $2.5" exhibit |
| Q2 FY2026 | "The current guidance reflects the May 2026 acquisition of Levis Commons Town Center, but does not include the impact of any additional acquisition or sale of any outparcels, properties or joint venture interests, or any additional financing activity." exhibit |
| Q2 FY2026 | "Such risks and uncertainties include, but are not limited to: risks associated with general economic and financial conditions, including inflationary iv pressures and recessionary fears; newly-imposed and potentially additional U.S. tariffs and responsive non-U.S. tariffs; increased capital costs and capital markets volatility; increases in unemployment and reduced consumer confidence and spending; risks related to our ability to acquire or develop new retail centers or expand existing retail centers successfully; risks related to the financial performance and market value of our retail center" exhibit |
| Q2 FY2026 | "In December 2018, Nareit issued “Nareit Funds From Operations White Paper - 2018 Restatement,” which clarifies, where necessary, existing guidance and consolidates alerts and policy bulletins into a single document for ease of use." exhibit |
Get this as JSON
curl -H "X-API-Key: vt_live_..." https://api.veritasdata.dev/v1/next/SKT
# how far back the record goes for this company
curl -H "X-API-Key: vt_live_..." https://api.veritasdata.dev/v1/coverage/SKT
Put this date on your page
A badge that stays current. It links back to this page and needs no key. Embed it unmodified, with its link to this page intact: the badge is too small to carry the notice below, so the page it links to does.
Read by software from public filings and company announcements. Can be wrong. Verify with the company or the SEC. Not investment advice.
HTML
<a href="https://veritasdata.dev/company/SKT/"><img src="https://veritasdata.dev/embed/SKT.svg" alt="SKT earnings date" width="240" height="56"></a>
Markdown
[](https://veritasdata.dev/company/SKT/)
Script
<script async src="https://veritasdata.dev/embed/SKT.js"></script>
Get a free key: 100 calls, every company
Sign in with GitHub or Google. The key works on every endpoint and in the MCP server.
curl -H "X-API-Key: vt_live_..." "https://api.veritasdata.dev/v1/next/SKT"
Dates come only from SEC EDGAR and company announcements. Nothing here is investment advice.