 Veritas Data
MOLSON COORS BEVERAGE CO (TAP) earnings date
Feb 16, 2027, before open estimated
Estimated from the company's SEC filing cadence. The company has not confirmed it. Companies usually announce two to four weeks ahead.
- Fiscal period
- Q4 FY2026
- Confidence
- 45% chance of landing within a day
- Source
- Filing history on EDGAR
- Last checked
- 2026-11-20
Read by software from public filings and company announcements. Can be wrong. Verify with the company or the SEC. Not investment advice.
How this company behaves
| Announces its report date | Not enough announcements on file yet to say |
| Reports after the quarter ends | 36 days, typically, give or take 6 (last 8 releases) |
Last 8 releases
| Period | Released | Timing | Days after period end | Filing |
|---|---|---|---|---|
| Q3 FY2026 | Thu, Nov 5, 2026 | before open | 36 | 8-K |
| Q2 FY2026 | Thu, Aug 6, 2026 | before open | 37 | 8-K |
| Q1 FY2026 | Thu, Apr 30, 2026 | before open | 30 | 8-K |
| Q4 FY2025 | Wed, Feb 18, 2026 | after close | 49 | 8-K |
| Q3 FY2025 | Tue, Nov 4, 2025 | before open | 35 | 8-K |
| Q2 FY2025 | Tue, Aug 5, 2025 | before open | 36 | 8-K |
| Q1 FY2025 | Thu, May 8, 2025 | before open | 38 | 8-K |
| Q4 FY2024 | Thu, Feb 13, 2025 | before open | 44 | 8-K |
What they guided beta
| Q3 FY2026 | "Net sales: The following table highlights the drivers of the change in net sales for the three months ended September 30, 2026, compared to September 30, 2025 (in percentages): Net Sales Drivers (unaudited) Financial volume (3.0) % Price and sales mix 1.8 % Currency (0.4) % Total consolidated net sales (1.6) % 2 Net sales decreased 1.6%, driven by lower financial volume and unfavorable foreign currency impacts, partially offset by favorable price and sales mix." exhibit |
| Q3 FY2026 | "Net sales: The following table highlights the drivers of the change in net sales for the three months ended September 30, 2026 compared to September 30, 2025 (in percentages): Net Sales Drivers (unaudited) Financial volume (2.9) % Price and sales mix 1.9 % Currency (0.2) % Total Americas net sales (1.2) % 4 Net sales decreased 1.2%, driven by lower financial volume and unfavorable foreign currency impacts, partially offset by favorable price and sales mix." exhibit |
| Q3 FY2026 | "Net sales: The following table highlights the drivers of the change in net sales for the three months ended September 30, 2026, compared to September 30, 2025 (in percentages): Net Sales Drivers (unaudited) Financial volume (3.0) % Price and sales mix 1.0 % Currency (0.7) % Total EMEA&APAC net sales (2.7) % Net sales decreased 2.7% driven by lower financial volume and unfavorable foreign currency impacts, partially offset by favorable price and sales mix." exhibit |
| Q3 FY2026 | "Un derlying (Non-GAAP) free cash flow: Cash provided of $852.0 million for the nine months ended September 30, 2026, represented an increase of $69.9 million from the prior year, primarily due to an increase in net cash provided by operating activities and lower capital expenditures." exhibit |
| Q3 FY2026 | "Share Repurchase Program: We paid $254.9 million and $332.8 million, including brokerage commissions, for share repurchases for the nine months ended September 30, 2026 and September 30, 2025, respectively. 6 2026 OUTLOOK We have adjusted our 2026 guidance for certain key financial metrics due to the impacts of the global macroeconomic environment on the beer industry and on consumer behavior along with persistent promotional activity in the U.K." exhibit |
| Q2 FY2026 | "Net sales: The following table highlights the drivers of the change in net sales for the three months ended June 30, 2026, compared to June 30, 2025 (in percentages): Net Sales Drivers (unaudited) Financial volume (5.4) % Price and sales mix 1.8 % Currency 0.3 % Total consolidated net sales (3.3) % Net sales decreased 3.3%, driven by lower financial volume, partially offset by favorable price and sales mix and favorable foreign currency impacts." exhibit |
| Q2 FY2026 | "Underlying (Non-GAAP) net income (loss) attributable to MCBC per diluted share: Underlying net income attributable to MCBC per diluted share decreased 22.9%, primarily due to lower underlying income before income taxes, partially offset by lower weighted-average shares outstanding driven by share repurchases. 3 QUARTERLY SEGMENT HIGHLIGHTS (VERSUS SECOND QUARTER 2025 RESULTS) Americas Segment Overview The following table highlights the Americas segment results for the three and six months ended June 30, 2026 compared to June 30, 2025: For the three months ended ($ in millions) (Unaudited) June" exhibit |
| Q2 FY2026 | "Net sales: The following table highlights the drivers of the change in net sales for the three months ended June 30, 2026 compared to June 30, 2025 (in percentages): Net Sales Drivers (unaudited) Financial volume (6.4) % Price and sales mix 2.3 % Currency — % Total Americas net sales (4.1) % Net sales decreased 4.1%, driven by lower financial volume, partially offset by favorable price and sales mix." exhibit |
| Q2 FY2026 | "Net sales: The following table highlights the drivers of the change in net sales for the three months ended June 30, 2026, compared to June 30, 2025 (in percentages): Net Sales Drivers (unaudited) Financial volume (2.8) % Price and sales mix 0.8 % Currency 1.6 % Total EMEA&APAC net sales (0.4) % Net sales decreased 0.4% driven by lower financial volume, partially offset by favorable foreign currency impacts and favorable price and sales mix." exhibit |
| Q2 FY2026 | "Un derlying (Non-GAAP) free cash flow: Cash provided of $513.8 million for the six months ended June 30, 2026, represented an increase of $220.3 million from the prior year, primarily due to an increase in net cash provided by operating activities and lower capital expenditures." exhibit |
Get this as JSON
curl -H "X-API-Key: vt_live_..." https://api.veritasdata.dev/v1/next/TAP
# how far back the record goes for this company
curl -H "X-API-Key: vt_live_..." https://api.veritasdata.dev/v1/coverage/TAP
Put this date on your page
A badge that stays current. It links back to this page and needs no key. Embed it unmodified, with its link to this page intact: the badge is too small to carry the notice below, so the page it links to does.
Read by software from public filings and company announcements. Can be wrong. Verify with the company or the SEC. Not investment advice.
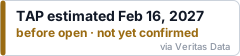
HTML
<a href="https://veritasdata.dev/company/TAP/"><img src="https://veritasdata.dev/embed/TAP.svg" alt="TAP earnings date" width="240" height="56"></a>
Markdown
[](https://veritasdata.dev/company/TAP/)
Script
<script async src="https://veritasdata.dev/embed/TAP.js"></script>
Get a free key: 100 calls, every company
Sign in with GitHub or Google. The key works on every endpoint and in the MCP server.
curl -H "X-API-Key: vt_live_..." "https://api.veritasdata.dev/v1/next/TAP"
Dates come only from SEC EDGAR and company announcements. Nothing here is investment advice.