 Veritas Data
INTERFACE INC (TILE) earnings date
Feb 23, 2027, before open estimated
Estimated from the company's SEC filing cadence. The company has not confirmed it. Companies usually announce two to four weeks ahead.
- Fiscal period
- Q4 FY2026
- Confidence
- 67% chance of landing within a day
- Source
- Filing history on EDGAR
- Last checked
- 2026-11-18
Read by software from public filings and company announcements. Can be wrong. Verify with the company or the SEC. Not investment advice.
How this company behaves
| Announces its report date | Not enough announcements on file yet to say |
| Reports after the quarter ends | 33 days, typically, give or take 12 (last 8 releases) |
Last 8 releases
| Period | Released | Timing | Days after period end | Filing |
|---|---|---|---|---|
| Q3 FY2026 | Fri, Nov 6, 2026 | before open | 33 | 8-K |
| Q2 FY2026 | Fri, Aug 7, 2026 | before open | 33 | 8-K |
| Q1 FY2026 | Fri, May 8, 2026 | before open | 33 | 8-K |
| Q4 FY2025 | Tue, Feb 24, 2026 | before open | 58 | 8-K |
| Q3 FY2025 | Fri, Oct 31, 2025 | before open | 33 | 8-K |
| Q2 FY2025 | Fri, Aug 1, 2025 | before open | 33 | 8-K |
| Q1 FY2025 | Fri, May 2, 2025 | before open | 33 | 8-K |
| Q4 FY2024 | Tue, Feb 25, 2025 | before open | 58 | 8-K |
What they guided beta
| Q3 FY2026 | "Document FOR IMMEDIATE RELEASE Media Contact: Christine Needles Global Corporate Communications Christine.Needles@interface.com +1 404-491-4660 Investor Contact: Bruce Hausmann Chief Financial Officer Bruce.Hausmann@interface.com +1 770-437-6802 Interface Reports Third Quarter 2026 Results Disciplined execution drives earnings growth; Company reaffirms full year earnings guidance ATLANTA – November 6, 2026 – Interface, Inc. (Nasdaq: TILE), the global flooring and sustainability leader, today announced results for the third quarter ended October 4, 2026." exhibit |
| Q3 FY2026 | "Additional Metrics 10/4/2026 12/28/2025 Change Cash $ 81.1 $ 71.3 13.7 % Total Debt $ 130.2 $ 181.6 (28.3) % Total Debt Minus Cash ("Net Debt") $ 49.1 $ 110.3 (55.4) % Last 12-Months Adjusted EBITDA $ 253.6 Total Debt divided by Last 12-Months Net Income 0.9x Net Debt divided by Last 12-Months Adjusted EBITDA ("Net Leverage Ratio") 0.2x 2 Segment Results Summary (Unaudited) Three Months Ended Nine Months Ended (in millions, except percentages) 10/4/2026 9/28/2025 Change 10/4/2026 9/28/2025 Change AMS Net Sales $ 219.4 $ 218.6 0.3 % $ 662.7 $ 638.0 3.9 % Currency-Neutral Net Sales $ 219.6 $ 218" exhibit |
| Q3 FY2026 | "With that backdrop in mind, Interface anticipates the following: Full Fiscal Year 2026 Outlook Previous Full Fiscal Year 2026 Outlook Net sales $1.440 to $1.455 billion $1.455 to $1.485 billion Adjusted gross profit margin 40.4% of net sales 40.6% of net sales Adjusted SG&A expenses $387 million $395 million Adjusted interest & other expenses $14 million $15 million Adjusted effective income tax rate 25.0% 26.0% Capital expenditures $60 million $60 million Fully diluted weighted average share count 58.5 million shares 58.6 million shares Note: All figures are approximate and guidance includes " exhibit |
| Q2 FY2026 | "Document FOR IMMEDIATE RELEASE Media Contact: Christine Needles Global Corporate Communications Christine.Needles@interface.com +1 404-491-4660 Investor Contact: Bruce Hausmann Chief Financial Officer Bruce.Hausmann@interface.com +1 770-437-6802 Interface Reports Second Quarter 2026 Results Operational execution drives strong quarter; Company raises full year guidance ATLANTA – August 7, 2026 – Interface, Inc. (Nasdaq: TILE), the global flooring and sustainability leader, today announced results for the second quarter ended July 5, 2026." exhibit |
| Q2 FY2026 | "Second quarter 2026 adjusted gross profit margin increased 524 basis points year-over-year due to favorable price/mix, lower manufacturing costs on higher sales volumes and manufacturing efficiency initiatives, and IEEPA tariff refunds." exhibit |
| Q2 FY2026 | "Additional Metrics 7/5/2026 12/28/2025 Change Cash $ 81.5 $ 71.3 14.3 % Total Debt $ 204.4 $ 181.6 12.5 % Total Debt Minus Cash ("Net Debt") $ 122.8 $ 110.3 11.4 % Last 12-Months Adjusted EBITDA $ 250.5 Total Debt divided by Last 12-Months Net Income 1.4x Net Debt divided by Last 12-Months Adjusted EBITDA ("Net Leverage Ratio") 0.5x 2 Segment Results Summary (Unaudited) Three Months Ended Six Months Ended (in millions, except percentages) 7/5/2026 6/29/2025 Change 7/5/2026 6/29/2025 Change AMS Net Sales $ 247.7 $ 239.4 3.4 % $ 443.3 $ 419.4 5.7 % Currency-Neutral Net Sales $ 247.7 $ 239.4 3.5 " exhibit |
| Q2 FY2026 | "With that backdrop in mind, Interface anticipates the following: Q3 Fiscal Year 2026 Outlook Net sales $370 to $380 million Adjusted gross profit margin 40.8% of net sales Adjusted SG&A expenses $100 million Adjusted interest & other expenses $4 million Adjusted effective income tax rate 27.5% Fully diluted weighted average share count 58.2 million shares Note: All figures are approximate Full Fiscal Year 2026 Outlook Previous Full Fiscal Year 2026 Outlook Net sales $1.455 to $1.485 billion $1.450 to $1.480 billion Adjusted gross profit margin 40.6% of net sales 38.8% to 39.0% of net sales Adj" exhibit |
Get this as JSON
curl -H "X-API-Key: vt_live_..." https://api.veritasdata.dev/v1/next/TILE
# how far back the record goes for this company
curl -H "X-API-Key: vt_live_..." https://api.veritasdata.dev/v1/coverage/TILE
Put this date on your page
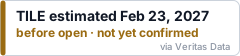
A badge that stays current. It links back to this page and needs no key. Embed it unmodified, with its link to this page intact: the badge is too small to carry the notice below, so the page it links to does.
Read by software from public filings and company announcements. Can be wrong. Verify with the company or the SEC. Not investment advice.
HTML
<a href="https://veritasdata.dev/company/TILE/"><img src="https://veritasdata.dev/embed/TILE.svg" alt="TILE earnings date" width="240" height="56"></a>
Markdown
[](https://veritasdata.dev/company/TILE/)
Script
<script async src="https://veritasdata.dev/embed/TILE.js"></script>
Get a free key: 100 calls, every company
Sign in with GitHub or Google. The key works on every endpoint and in the MCP server.
curl -H "X-API-Key: vt_live_..." "https://api.veritasdata.dev/v1/next/TILE"
Dates come only from SEC EDGAR and company announcements. Nothing here is investment advice.