 Veritas Data
TRINITY INDUSTRIES INC (TRN) earnings date
Feb 18, 2027, before open estimated
Estimated from the company's SEC filing cadence. The company has not confirmed it. Companies usually announce two to four weeks ahead.
- Fiscal period
- Q4 FY2026
- Confidence
- 52% chance of landing within a day
- Source
- Filing history on EDGAR
- Last checked
- 2026-11-18
Read by software from public filings and company announcements. Can be wrong. Verify with the company or the SEC. Not investment advice.
How this company behaves
| Announces its report date | Not enough announcements on file yet to say |
| Reports after the quarter ends | 30 days, typically, give or take 8 (last 8 releases) |
Last 8 releases
| Period | Released | Timing | Days after period end | Filing |
|---|---|---|---|---|
| Q3 FY2026 | Thu, Oct 29, 2026 | during market hours | 29 | 8-K |
| Q2 FY2026 | Thu, Jul 30, 2026 | before open | 30 | 8-K |
| Q1 FY2026 | Thu, Apr 30, 2026 | before open | 30 | 8-K |
| Q4 FY2025 | Thu, Feb 12, 2026 | before open | 43 | 8-K |
| Q3 FY2025 | Thu, Oct 30, 2025 | before open | 30 | 8-K |
| Q2 FY2025 | Thu, Jul 31, 2025 | during market hours | 31 | 8-K |
| Q1 FY2025 | Thu, May 1, 2025 | before open | 31 | 8-K |
| Q4 FY2024 | Thu, Feb 20, 2025 | before open | 51 | 8-K |
What they guided beta
| Q3 FY2026 | "Last twelve months ("LTM") Return on Equity ("ROE") of 29.1% and Adjusted ROE of 31.8% 2026 Guidance" exhibit |
| Q3 FY2026 | "We are raising our expectations for full-year secondary market gains on railcar sales and expect to finish the year within our EPS guidance range of $2.20 to $2.40.”" exhibit |
| Q3 FY2026 | "(1) Excludes items outside our core business operations 1 Consolidated Financial Summary Three Months Ended September 30, 2026 2025 Year over Year – Comparison ($ in millions, except per share amounts) Revenues $ 535.1 $ 454.1 Higher external deliveries and the mix of external repairs, partially offset by reduced revenues resulting from the divestitures of two partially-owned leasing subsidiaries since the prior year period Operating profit $ 95.6 $ 118.6 Lower gains on lease portfolio sales and higher selling, engineering, and administrative expenses, partially offset by a gain on the sale o" exhibit |
| Q3 FY2026 | "The all-in interest rate for the Series 2019-2 Notes was 3.10% per annum. 2 Business Group Summary Three Months Ended September 30, 2026 2025 Year over Year – Comparison ($ in millions) Railcar Leasing and Services Group Revenues $ 286.3 $ 301.0 Reduced revenues resulting from the divestitures of two partially-owned leasing subsidiaries since the prior year period, partially offset by the mix of repairs, higher lease rates, and net additions to the lease fleet Operating profit $ 98.0 $ 128.1 Lower gains on lease portfolio sales, as well as the mix of external repairs and operational inefficien" exhibit |
| Q2 FY2026 | "Last twelve months ("LTM") Return on Equity ("ROE") of 30.2% and Adjusted ROE of 32.4% 2026 Guidance" exhibit |
| Q2 FY2026 | "With a meaningful increase in delivery volumes in the second half of the year, our full-year margin outlook of 5% to 6% is unchanged." "The industrial indicators underpinning our markets, including manufacturing PMI, carload growth, and customer inquiry levels, have each trended positively, and we believe the freight cycle is turning in rail's favor." Ms." exhibit |
| Q2 FY2026 | "Savage concluded, "With our leasing platform performing well, our balance sheet in strong shape, and our full-year EPS guidance of $2.20 to $2.40 intact, we are confident in Trinity's ability to continue generating above-market returns for our shareholders." (1) Excludes items outside our core business operations 1 Consolidated Financial Summary Three Months Ended June 30, 2026 2025 Year over Year – Comparison ($ in millions, except per share amounts) Revenues $ 485.1 $ 506.2 Reduced revenues resulting from the divestitures of two partially-owned leasing subsidiaries since the prior year peri" exhibit |
| Q2 FY2026 | "Partially-owned lease fleet (in units) — 23,260 Investor-owned lease fleet (in units) 50,650 34,205 Rail Products Group Revenues $ 258.5 $ 293.5 Lower deliveries Operating profit $ 3.4 $ 8.9 Lower deliveries and the impact of a production interruption in one of our manufacturing facilities Operating profit margin 1.3 % 3.0 % New railcars: Deliveries (in units) 1,570 1,815 Orders (in units) 1,560 2,310 Order value $ 189.3 $ 318.3 Backlog value $ 1,585.2 $ 1,959.8 Sustainable railcar conversions: Deliveries (in units) 115 25 Backlog (in units) 370 — Backlog value $ 28.2 $ — Eliminations Eliminat" exhibit |
Get this as JSON
curl -H "X-API-Key: vt_live_..." https://api.veritasdata.dev/v1/next/TRN
# how far back the record goes for this company
curl -H "X-API-Key: vt_live_..." https://api.veritasdata.dev/v1/coverage/TRN
Put this date on your page
A badge that stays current. It links back to this page and needs no key. Embed it unmodified, with its link to this page intact: the badge is too small to carry the notice below, so the page it links to does.
Read by software from public filings and company announcements. Can be wrong. Verify with the company or the SEC. Not investment advice.
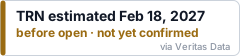
HTML
<a href="https://veritasdata.dev/company/TRN/"><img src="https://veritasdata.dev/embed/TRN.svg" alt="TRN earnings date" width="240" height="56"></a>
Markdown
[](https://veritasdata.dev/company/TRN/)
Script
<script async src="https://veritasdata.dev/embed/TRN.js"></script>
Get a free key: 100 calls, every company
Sign in with GitHub or Google. The key works on every endpoint and in the MCP server.
curl -H "X-API-Key: vt_live_..." "https://api.veritasdata.dev/v1/next/TRN"
Dates come only from SEC EDGAR and company announcements. Nothing here is investment advice.